No Light Rail in Vancouver!
New Starts Still Suffer Overruns, Ridership Shortfalls

How close to rail transit projects come to meeting their promises of being completed on budget and attracting the projected number of passengers? If you listen to transit agencies, almost every project is completed on time and beats its ridership goals. But those numbers aren’t very reliable as the transit agencies base their claims on projections made shortly before the projects were completed, not when the decision was made to build them.
In the early years of the Bush administration, the Federal Transit Administration commissioned a study to find out how well they were doing. The study was completed in 2003 — and the FTA then sat on it for four years. Now, they have finally released it, and you can download it here (4.4 MB Word file).
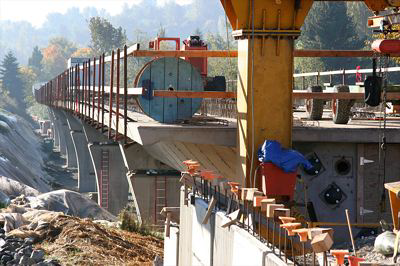
Is this light-
Flickr photo by brewbooks.
The report was “primarily authored” by Frank Spielberg of SG Associates and Steven
Lewis-
Projects that began in the 1980s, the report estimates, went an average of 40 percent
or more over budget. By the 1990s, this was down to around 20 percent. However, this
should not be much cause for cheer among rail proponents. For one thing (as documented
here), some newer projects that were not evaluated in the Spielberg report have gone
far more than 20 percent over budget. The Hudson-
Spielberg and Lewis-
Several others cost 40 percent or more less than projected. However, some of the
numbers sound suspicious: can Baltimore really run a light-
If projections of operating costs turned out to be okay on average, projections of ridership were drastically overestimated. On average, actual ridership is falling short of projections by 35 percent. To be fair, most of the projections were for 2005 while the actual numbers were for 2002. But most transit agencies did not experience a huge increase in riders between 2002 and 2005, so updating to 2005 numbers would not significantly improve the results.
The report does not compare projections of new riders with actual new riders, giving
the excuse that new riders are difficult to calculate based on published numbers.
But we know that the Dallas light-
The St. Louis light-
On top of the cost overruns and ridership shortfalls, the report notes that the average transit project took eight years to complete — that is, eight years after publication of the environmental impact statement. The median was six years. That’s a long time to wait for supposedly improved transportation.
The Spielberg report is nearly 200 pages long, most of it devoted to an in-
Trackback • Posted in Transportation
3
Reprinted from The Antiplanner