No Light Rail in Vancouver!
Rail, Energy, & CO2: Part 2 — Results for 2005

Does rail transit save energy and reduce greenhouse gas emissions? Based on the results for 2005, the answer seems to be mostly “no.” These results are found in two downloadable spreadsheets: the National Transit Database summary (1.4 MB) and a summary spreadsheet for rail cities. You can also download a spreadsheet with the calculations of BTUs and CO2. A brief explanation of the spreadsheets and a guide to abbreviations can be found at the end of this post.
Here is a summary of the results:
* As noted in part 1, “automobile” is the average for passenger cars, not including light trucks (pickups and SUVs).
Of course, as always, summaries can be deceptive without more detailed analyses. But I think we can drop much further consideration of the mode known as “automated guideways.” Of the three guideways in the database (Detroit, Jacksonville, and Miami), Miami’s does best, but it requires more than 6,000 BTUs and emits more than 1.25 pounds of CO2 per passenger mile.
On average, light rail is about par with autos, though of course some lines are better and some are worse. Only commuter rail and heavy rail use, on average, less energy than cars, but they don’t save much in the way of greenhouse gases.
Most trolley bus routes are concentrated in urban cores where transit usage is particularly heavy. So it is surprising that they do so poorly. Of the four cities that operated trolley buses in 2005 (Boston, Dayton, San Francisco, and Seattle), only those in San Francisco matched cars for energy efficiency, though not CO2 emissions.
The urban area part of the NTD spreadsheet reveals that transit systems, taken as
a whole, use less energy than the auto in only a handful of urban areas: New York,
Los Angeles, Chicago (barely), Boston, Atlanta, San Francisco-
Of course, all of these urban areas except Phoenix and Honolulu have rail transit, so this might be considered a validation of rail transit. But what really makes most of these rail regions exceptional is the concentration of jobs.
It is also worth noting that most of the regions with efficient rail systems also
have exceptionally efficient bus systems. In Los Angeles, the buses do far better
than autos while the rail lines lag behind. In Atlanta the buses and rail system
both do better than autos. The New York MTA bus system does better than most of the
region’s commuter-
Los Angeles buses do well because they carry an average of 16 people, compared with the national average of 10. Atlanta buses may do well because most of them use compressed natural gas rather than Diesel fuel.
Take a look at the rail summary spreadsheet to get a better idea of how well transit
works in each urban area. This spreadsheet is just a summary of the NTD spreadsheet,
and it leaves out many of the smaller bus agencies in regions like New York, Los
Angeles, and San Francisco-
The charts below further summarize the results for each of the three main types of rail transit.
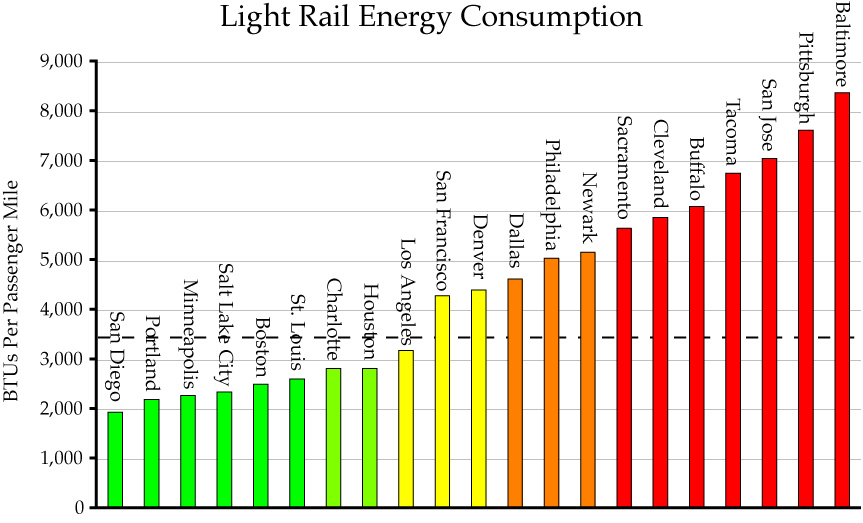
A majority of light-
A few cities — Houston, Minneapolis, Portland, Salt Lake City, San Diego, St. Louis
— have installed new light-
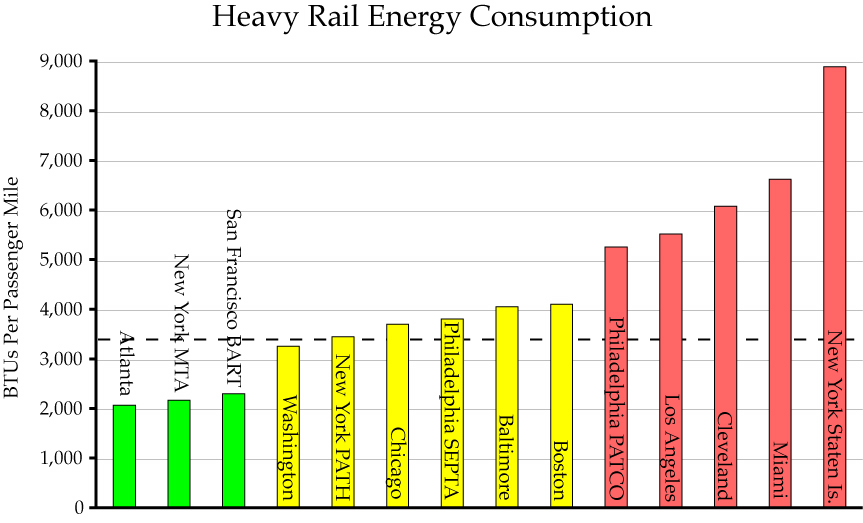
Only three heavy-
New heavy rail systems in Atlanta, San Francisco, and Washington seem to be efficient,
but not those in Baltimore or Miami. Atlanta’s is not much more efficient than its
buses and Washington’s is only slightly more efficient than autos, so the only real
winner among new heavy-
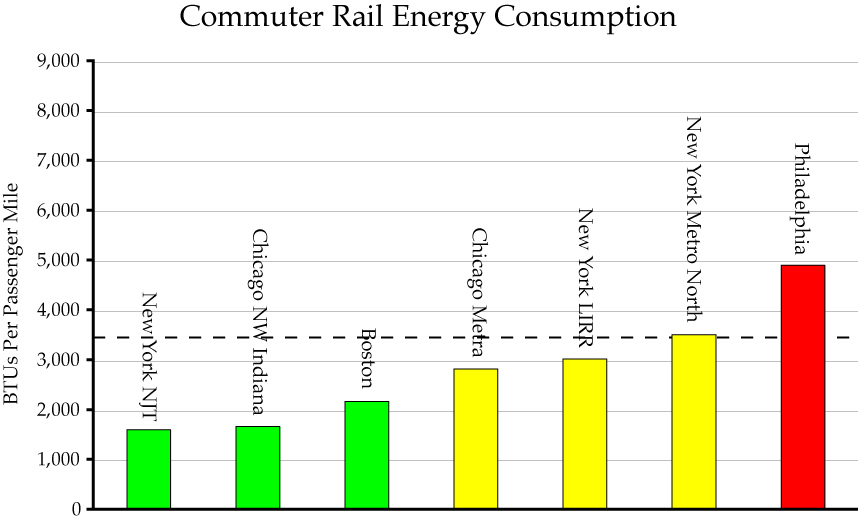
Most commuter-
We have no commuter rail data for any city with new commuter lines (Dallas, Ft. Lauderdale, L.A., San Diego, San Jose, Seattle, Washington). I suspect if we did we would find the same thing as for light and heavy rail: not much gain in most cases.
Regions with older rail systems — Boston, Chicago, Cleveland, New York, Philadelphia,
Pittsburgh — are a mixed bag. Rail does okay in Boston and New York, but it is marginal
in Chicago and does poorly in the other cities. Since buses are fairly efficient
in Boston and New York, it seems likely that a transit-
These results suggest that, if your bus system is not very energy efficient — think Baltimore, Cleveland, Dallas, Denver, Miami, Sacramento, and San Jose — then rail is not likely to do much better and will probably be much worse. Transit agencies in these regions should focus on improving their bus ridership before even dreaming about rail.
Most of the cities where new rail lines appear to be successful had highly successful bus systems when they began building rail. As I’ve noted previously, rail must be supported by feeder buses, and so the energy efficiency of transit systems must be considered as a whole. We’ll find out later this week what this means for these cities.
Spreadsheet Interpretation
The NTD summary sheet is divided into three parts. Rows 1 through 1368 are mode-
The Rail summary spreadsheet takes the passenger miles, BTUs, and CO2 data from the
NTD spreadsheet for all commuter-
Here are a few of the less obvious abbreviations used in the spreadsheets:
AG -
BTU -
CO2 -
CR -
DR -
FB -
HR -
IP -
LR -
MB -
PM -
TB -
UZA -
VP -
VRH -
VRM -
VT -
Here are the factors I used to calculate BTUs and CO2 emissions. The factors are all per gallon except for electricity which is per kilowatt hour. If you have a hard time reading this table, you can download it in the form of a Word document.
7
Trackback • Posted in Transportation
Reprinted from The Antiplanner
. Mode BTU/PM CO2/PM
. Guideway 10,573 2.05
. Commuter Rail 2,766 0.50
. Light rail 3,458 0.67
. Heavy rail 2,692 0.52
. Motor Bus 3,733 0.66
. Trolley bus 4,004 0.77
. All transit 3,276 0.60
. Automobile* 3,445 0.54
. BTUs/unit CO2/unit
. Diesel 138,700 22.384
. Gas 125,000 19.564
. LPG 95,500 12.805
. LNG 90,800 13.360
. Methanol 64,600 19.608
. Ethanol 84,600 11.324
. Bunker 150,000 26.033
. CNG 35,500 23.598
. Kerosene 135,000 21.537
. BioDiesel 126,206 7.319
. Electricity 10,339 2.000