No Light Rail in Vancouver!
These data can be used to calculate energy use and emissions for most of the transit systems in the U.S. However, there are a few limitations. The National Transit Database only includes fuel numbers for transit lines that are directly operated by transit agencies. Agencies that contract out their operations to private companies such as Laidlaw or First Transit do not report the fuel those companies use. This means there are no results for many of the new commuter rail lines, including those in Dallas, Ft. Lauderdale, Los Angeles, San Diego, San Jose, Seattle, and the Washington DC area.
Yet we end up with data for almost every heavy-
This week’s analyses will be based on a few assumptions. First, various modes of
transport will be compared using BTUs and pounds of CO2 per passenger mile. Some
might say that passenger mile is the wrong measure because transit trips tend to
be shorter than auto trips. But that shortness reflects a cost, which is that transit
dependency limits mobility. It is an article of faith among smart-
Second, most new electricity demands in this country are supplied by coal. While
some regions (such as the Northwest) have hydroelectric power plants, virtually no
new hydro plants are being built and some are being removed. Wind farms supply some
renewable energy but even they must be backed by coal-
Third, this review will ignore the question of whether we really need a government policy to reduce energy consumption and greenhouse gases. Is peak oil a problem deserving of government rules and regulation? Is global climate change really a result of humans producing more greenhouse gases? The Antiplanner has a strong opinion about the first question and remains agnostic about the second. But we’ll skip the debate over those questions for the moment and concentrate on whether, if these are important issues, rail transit does the job.
An alternative to building rail is to encourage people to drive more fuel-
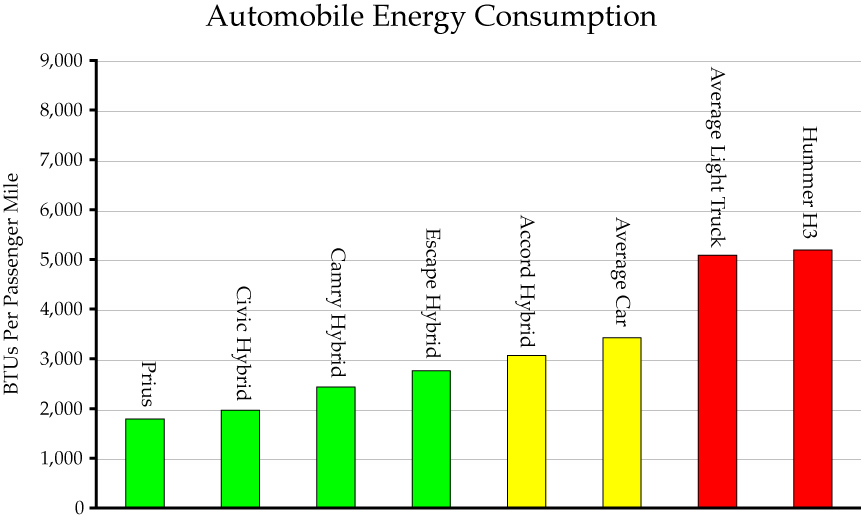
Fourth, our initial standard of comparison will be with the average passenger car,
which uses 3,445 BTUs and emits 0.54 pounds of CO2 per passenger mile. Admittedly,
light trucks (pick ups and SUVs) consume/emit more than this (although even a Hummer
is more fuel-
Based on these assumptions, I’ve posted a spreadsheet (1.4 MB) that includes energy consumption and CO2 emissions by transit system and mode. This is an expansion of the National Transit Database summary spreadsheet that I’ve previously posted, and it includes BTUs (calculated from National Transit Database table 17, “Energy Consumption”) and CO2 outputs. It also estimates averages for the transit systems in each urban area, with the caveat that transit services that are contracted out are mostly left out of these averages.
I’ve also posted a summary spreadsheet that lists BTUs and CO2 by mode for the transit systems in cities that have rail transit. Tomorrow the Antiplanner will discuss these results in detail. For now, you can review the results yourself or criticize my assumptions.
9
Trackback • Posted in Transportation
Does Rail Transit Save Energy or Reduce CO2 Emissions?

One reason often put forward to build rail transit is that it will save energy. Lately, rail advocates have added the claim that it will reduce greenhouse gas emissions.
Many people accept these statements without question. A recent NPR story argued that
“part of the solution (to global warming) is light rail.” The Antiplanner previously
noted a magazine that declared Portland the second-
This week, the Antiplanner is going to look at these claims in detail. Today we will
set up the problem. Tomorrow, we will look at actual energy consumption and CO2 emissions
by various transit systems in 2005, the most recent year for which data are available.
Later we will look at the construction costs of rail transit and examine energy consumption
and CO2 emissions before and after light-
Our data comes from several reputable sources:
1. The U.S. Department of Transportation’s National Transit Database, which includes a table showing energy consumption by mode for almost all public transit agencies in the country.
2. The U.S. Department of Energy’s Transportation Energy Data Book, which provides factors for converting gasoline, Diesel, kilowatt hours, and other energy sources into British Thermal Units (BTUs).
3. The Energy Information Administration, which provides coefficients for estimating CO2 emissions by energy source. Some coefficients are also found on this web site that focuses on calculating transit emissions.
4. For comparison, we’ll use the EPA’s new measure of fuel economy for automobiles. This new measure is more realistic than the old one and in many cases is even slightly conservative.
Reprinted from The Antiplanner