No Light Rail in Vancouver!
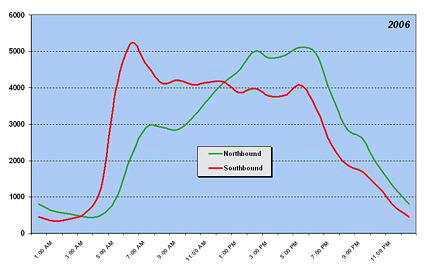
By comparison, the peaks in traffic on the I-
This shows that the maximum practical capacity of the two bridges is not much more than about 310,000 vehicles per day — and that will be accompanied by a lot more congestion that is experienced today. If demand really reaches 400,000 vehicles in 2025 (which isn’t that far away), some 80,000 to 90,000 of those trips are going to go somewhere else. This could mean more job growth in Vancouver, less in Portland. Or it could mean more job growth in Boise, Billings, or other less congested cities.
The problem with congestion is actually pretty simple. Freeway lanes can supposedly
move about 2,200 cars per hour, though it is probably somewhat higher if drivers
dare to drive closer together. But this is at about 40 to 50 miles per hour. If traffic
slows for any reason, the capacity rapidly declines. Let’s say traffic slows so that
the capacity falls below 1,500 cars per hour. Then traffic will be stop-
One solution to this problem is to make sure that traffic flows never exceed some lower number, say 1,800 vehicles per hour, that is less vulnerable to slowdowns. That is partly what ramp metering is about. But the better way is congestion tolling: just vary the tolls by traffic levels to make sure traffic never exceeds the target volume.
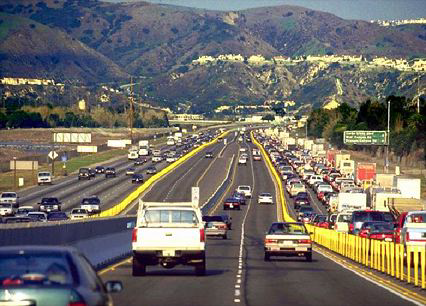
The above photo shows California SR91, with congestion-
Americans once resisted tolls but now appear to accept them as a solution to congestion. However, they (or at least the politicians they elect) still resist tolling lanes that have historically been free. So Robert Poole and others have suggested that we build HOT lane networks parallel to existing free lanes throughout urban areas. Such networks will make it possible for those who choose to pay tolls to get anywhere in the urban areas at rush hour in the same amount of time as it would take them at midnight.
Columbia River crossing planners did not seriously consider the idea of adding new
tolled lanes to supplement existing untolled lanes. Instead, they are more interested
in building a light-
Rail advocates love to compare rail capacities with actual highway volumes, but that is comparing apples to oranges. If a freeway lane carried 1,800 vehicles per hour 24 hours a day with 1.6 people per vehicle, it would move nearly 70,000 passenger miles per day. Considering peaks and troughs in flows, we have seen that actual uses max out at around 40,000 passenger miles a day. In the same way, rail lines have peaks and troughs in flows — most do not even operate 24 hours a day, and during the hours they operate, they only come close to capacity a few hours of the day.
Boston has the nation’s most heavily used light-
A mile of track occupies roughly the same space as a freeway lane, so freeways are
a more efficient use of land than light-
So Portland is proposing to spend a billion dollars replacing the bridges with new
freeway bridges of no greater capacity than today. These I-
To accommodate this demand, Portland wants to spend another billion dollars building
a light-
It would make a lot more sense to either build new highway bridges with greater capacities or build a third highway crossing somewhere. The new capacity, or new bridges, could be tolled to insure that it never gets congested. These tolls would help cover the costs, and probably could cover the entire cost of the new bridges if all lanes were tolled.
The good news is that the Federal Highway Administration is openly questioning Portland’s
anti-
Unless Portland’s policies change, if you plan to travel between Seattle and California anytime in the next fifty years, I strongly advise you to fly.
Trackback • Posted in News commentary, Transportation
A Billion Here, a Billion There, Pretty Soon You Are Talking About Real Money

Portland-
“The bridge is probably a billion,” says the project manager. “The transit piece, similar.” Plus various extras; it all adds up.
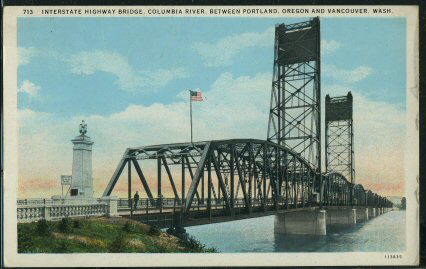
The original Columbia River bridge was built in 1917, and a duplicate bridge was added in 1958.
Wait just a minute. The bridge has three lanes in each direction. Each of those lanes carry far more people than are likely to ride on any transit line. Yet the transit line is expected to cost as much as the bridge?
Not only that, but the planners appear to be dead-
Now they have narrowed the selection to three alternatives, none of which expand
the roadways. Instead, the recommended alternatives are: do nothing, blow a huge
amount of money on bus-
Traffic records show that, shortly after the second bridge opened in 1958, about 30,000 vehicles a day crossed the twin bridges. By 1982, this had increased to 110,000 vehicles a day on six lanes.
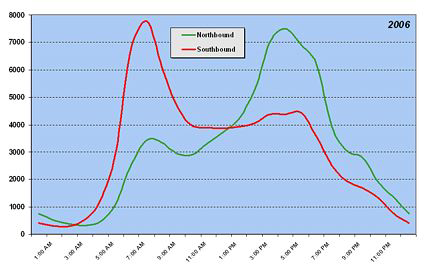
In late 1982, the states opened a parallel I-
A straight-
However, congestion could temper this use. Considering daily peaks and troughs, the
22,000 cars per lane on the I-
Rush-
Reprinted from The Antiplanner